
X3 SOLAR PROVIDES 60.2% MORE LIFETIME VALUE PER WATT OVER ROOFTOP/STATIONARY SOLAR
Our 5.68 kW Dual-Axis Solar System Produces as Much Electricity as a 9.1 kW Rooftop/Stationary Solar System.
What does that mean for you? A projected 36.4% higher lifetime return on your investment.
More Electricity. Fewer Panels. Lower Initial Investment. Greater Lifetime Returns.
1. The X3 Solar Advantage: Making Every Watt Work Harder
Traditional rooftop and stationary solar panels remain fixed in position while the sun moves across the sky. Their solar production is strongest when sunlight strikes the panels at favorable angles, but their fixed positioning limits energy capture throughout the day.
X3 Solar's MINIMITE dual-axis tracking technology follows the sun from morning through late afternoon, continuously adjusting the panels' orientation to capture more available sunlight.
Our actual field-performance comparisons, conducted under moderate and less-than-ideal conditions, established a substantial production advantage over conventional stationary solar.
X3 Solar's 5.68 kW dual-axis tracking system demonstrated production performance consistent with approximately 9.1 kW of conventional stationary solar capacity.
That represents:
60.2% more electricity produced per installed solar watt under the observed comparison.
37.6% less installed solar capacity to produce equivalent electricity.
Greater electricity generation during morning and afternoon hours when conventional fixed-position panels may operate below their peak capability.
The potential for substantially greater lifetime electricity value from fewer solar panels.
These performance results form the basis for our lifetime financial analysis.
2. How Does 5.68 kW Compete With 9.1 kW?
The difference is not in the rated wattage of the panels. The difference is how effectively those panels collect sunlight throughout the day.
Solar performance comparisonX3 Solar MINIMITETraditional stationary solarSolar panel capacity5.68 kW9.1 kWPositioningDual-axis sun trackingFixed positionEstimated annual electricity13,650 kWh13,650 kWhEstimated lifetime electricity321,539 kWh321,539 kWhSolar capacity needed5,680 watts9,100 wattsSolar capacity difference37.6% lessBaseline
The 60.2% advantage means that every 1,000 watts of X3 Solar tracking capacity can deliver the modeled production equivalent of approximately 1,602 watts of stationary solar.
For consumers, this means purchasing fewer watts of solar equipment without necessarily sacrificing annual electricity production.
The lifetime comparison assumes the production relationship continues under comparable operating conditions over 25 years.
3. Twenty-Five Years of Solar Electricity Production
Solar energy is a long-term investment. Evaluating a system solely by its first-year production or initial purchase price can overlook substantial differences in lifetime performance.
For this analysis, both systems are evaluated over 25 years using the same annual panel degradation rate of 0.5% and an electricity value of $0.209 per kWh.
Equal panel wattage comparison
25-year measurement5.68 kW stationary5.68 kW X3 dual-axisFirst-year electricity production8,520 kWh13,650 kWhLifetime electricity production200,697 kWh321,539 kWhLifetime electricity value$41,946$67,202Additional lifetime electricity value—+$25,256
The same 5.68 kW of solar panels can potentially generate $25,256 more electricity value over 25 years with X3 Solar's dual-axis tracking technology.
That is the significance of a 60.2% production advantage per watt: it can compound into substantially greater lifetime energy output.
These figures describe the value of electricity, not the net financial profit after system purchase and maintenance.
4. The Cost of Ownership: X3 Solar Versus Rooftop Solar
Greater production efficiency becomes especially valuable when it is combined with a lower initial purchase price.
For this example, we compare a $19,000 X3 Solar 5.68 kW installation with a $23,500 conventional 9.1 kW rooftop/stationary installation.
Both are modeled to produce the same annual electricity.
Investment comparisonX3 SolarRooftop/stationaryInstalled solar capacity5.68 kW9.1 kWInitial investment$19,000$23,500Annual electricity production13,650 kWh13,650 kWhFirst-year electricity value$2,853$2,85325-year electricity value$67,202$67,202Investment recovered through electricity value$19,000$23,500Net lifetime financial gain before operating costs$48,202$43,70225-year simple ROI253.7%186.0%Estimated simple payback6.7 years8.2 years
The X3 Solar customer invests $4,500 less upfront and receives the same modeled lifetime electricity value.
X3 Solar's projected 253.7% lifetime ROI is 36.4% higher than the conventional system's 186.0% ROI.
That is approximately 67.7 additional percentage points of return.
The $23,500 stationary price is an illustrative comparison based on our previously discussed pricing range. Actual customer quotes and equivalent equipment packages must be used for a final purchasing decision.
5. Your Savings and Investment Returns Over Time
Solar is an investment that generates financial value year after year.
The following table shows how that value accumulates for both systems, using a constant $0.209/kWh electricity value and 0.5% annual panel degradation.
Return on investment over time
YearsX3 Solar ROIStationary solar ROIX3 advantage in percentage points5-25.7%-39.9%+14.21046.8%18.7%+28.115117.5%75.9%+41.620186.5%131.6%+54.925253.7%186.0%+67.7
What these numbers mean for a homeowner
After 5 years: Both systems have already generated approximately $14,122 in electricity value. X3 Solar is substantially closer to recovering its initial investment.
After 10 years: X3 Solar has recovered its original purchase cost and generated approximately $8,895 in additional electricity value. The stationary system has generated approximately $4,395 beyond its purchase price.
After 15 years: X3 Solar has generated approximately $22,327 in net financial gain, compared with $17,827 for the stationary installation.
After 20 years: X3 Solar's accumulated net gain reaches approximately $35,426, representing a 186.5% return on its initial investment.
After 25 years: X3 Solar has generated approximately $48,202 in net financial gain after its purchase cost, with a projected 253.7% simple return.
These returns are before maintenance, replacements, financing, taxes and incentives. They are projections using a constant electricity rate, not historical 25-year customer savings.
6. More Than Electricity: Other Advantages of X3 Solar
X3 Solar's value proposition extends beyond the efficiency of its solar panels.
No rooftop solar installation required
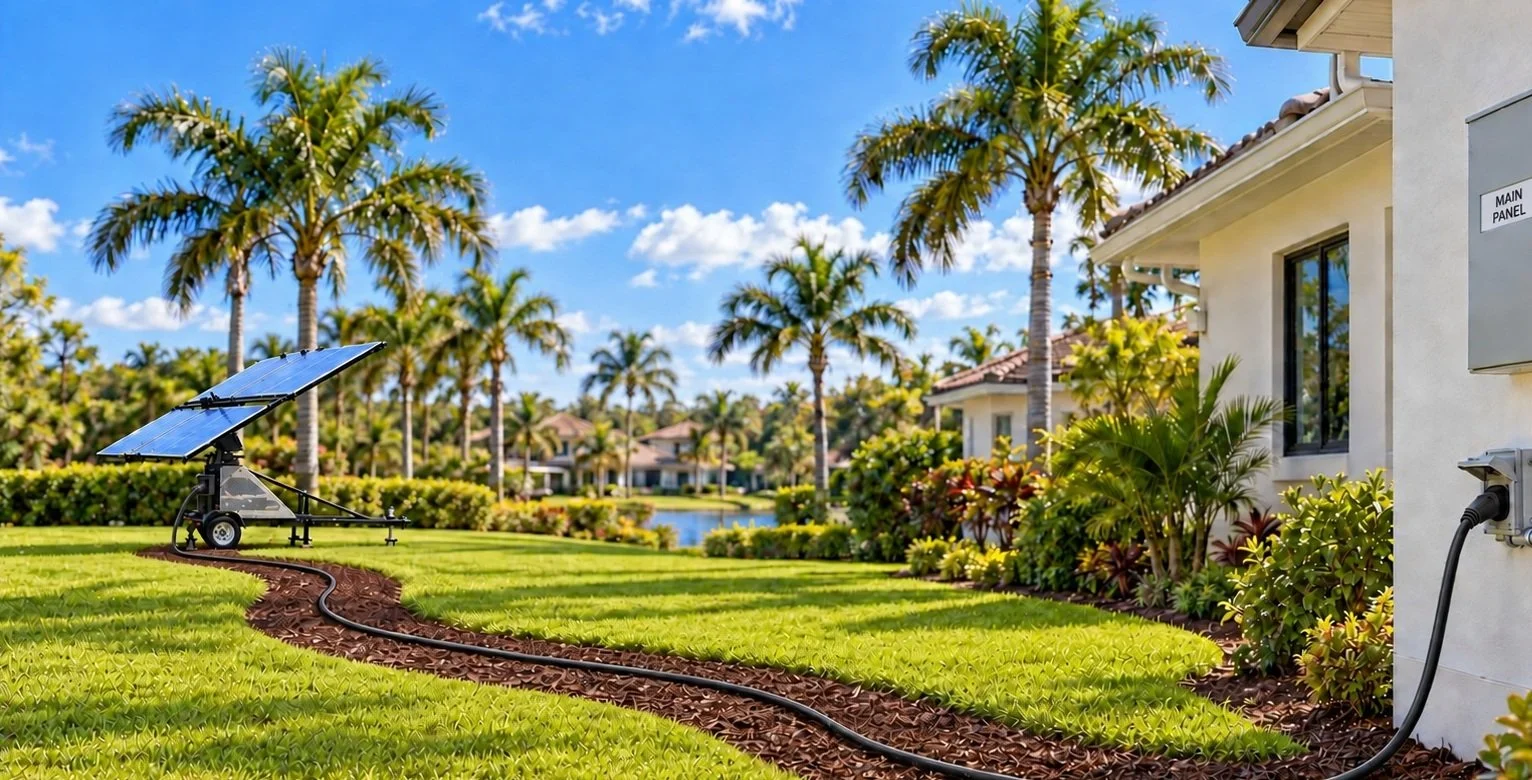
The MINIMITE is a pre-built, ground-mounted solar system.
This allows homeowners to generate electricity without permanently installing large solar arrays directly onto their roof.
Ground-mounted placement can also offer greater accessibility for service, cleaning, inspection and future adjustments.
Intelligent dual-axis solar tracking
Conventional rooftop solar typically performs most effectively during certain portions of the day, depending on orientation and roof pitch.
X3 Solar follows the sun throughout the day, allowing more effective solar collection during morning and afternoon hours.
This can provide additional value when household electricity demand extends beyond the midday production peak.
Fewer solar panels for equivalent electricity production
Our 5.68 kW system's demonstrated production comparison with a 9.1 kW stationary installation highlights the opportunity to generate substantial energy from a smaller solar array.
Fewer solar panels may reduce panel purchases and portions of the required mounting infrastructure, although the tracker introduces its own mechanical components.
Battery storage and backup power integration
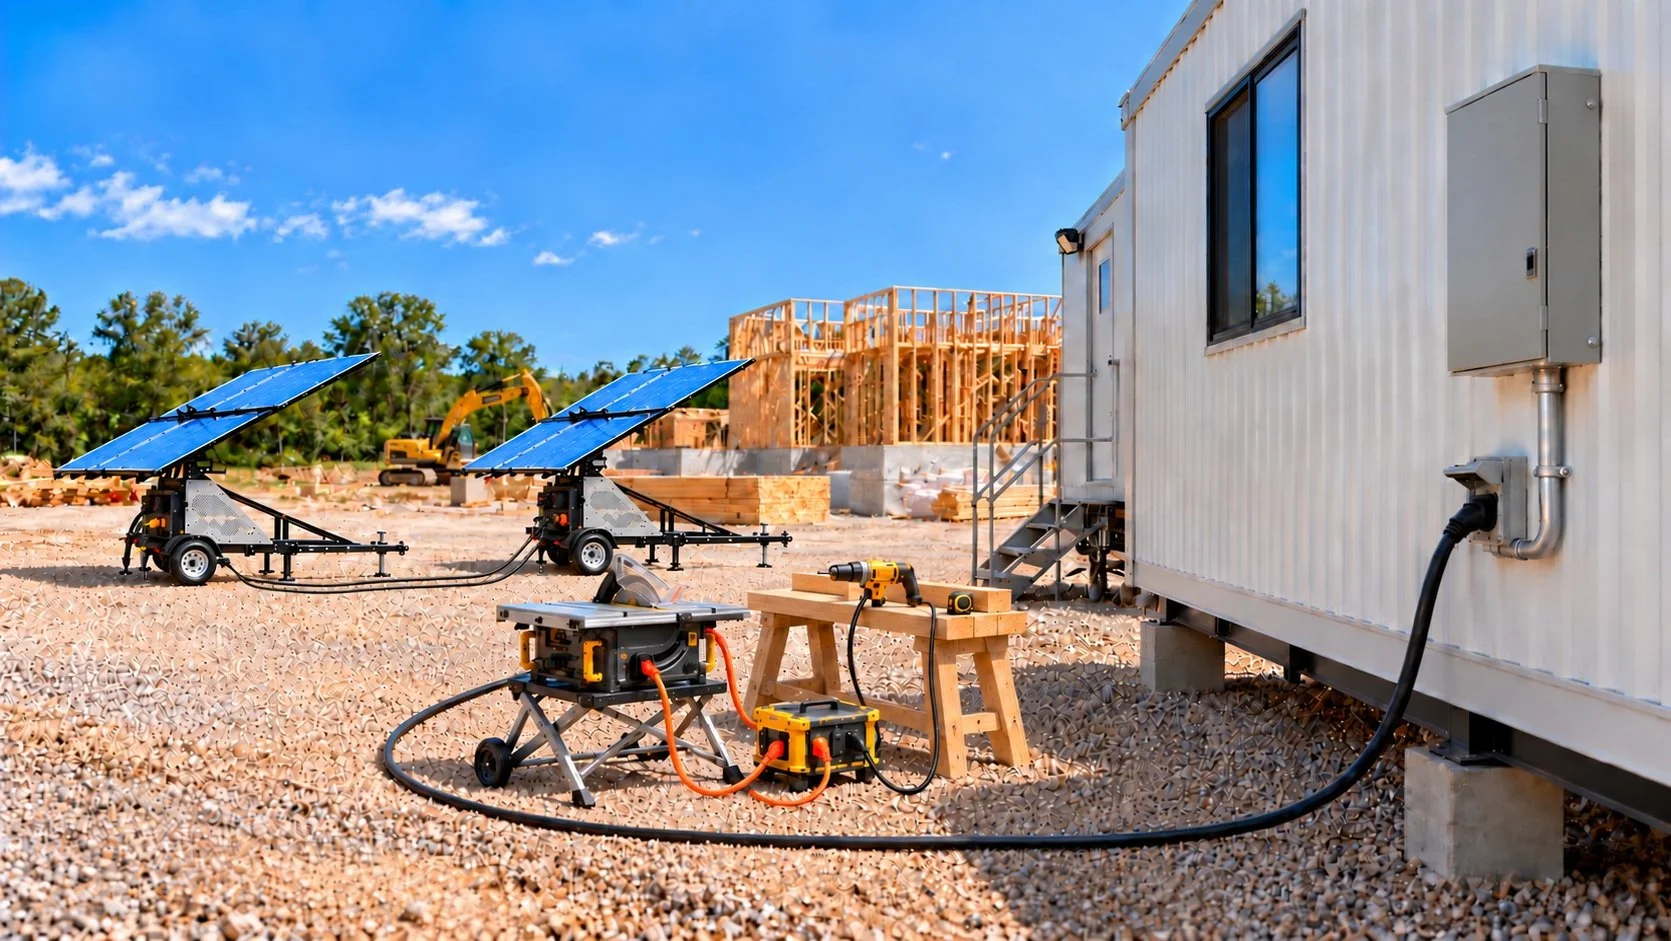
MINIMITE systems can be integrated with battery storage and compatible hybrid inverters.
Stored solar energy can support electricity use after sunset and provide backup capability when appropriately configured.
Unlike a conventional solar-only installation, an appropriately equipped X3 Solar system can support electrical loads even when utility service is unavailable.
Storm protection and system positioning
X3 Solar incorporates a protective flat positioning capability intended to reduce wind exposure.
Optional storm-protection hardware can provide additional structural reinforcement, subject to final engineering approval and installation requirements.
Accessibility and installation flexibility
Ground-mounted construction can simplify access for inspections and servicing.
System placement can also be evaluated independently of a property's existing roof configuration, subject to available space, sunlight exposure and local permitting requirements.
7. Why Lifetime Production Matters More Than Installed Wattage
When homeowners shop for solar, they are often presented with system wattage as the primary measurement.
But the wattage rating alone does not tell the full financial story.
A 9.1 kW stationary solar system is rated substantially higher than X3 Solar's 5.68 kW dual-axis system.
Nevertheless, our field-performance comparisons show how tracking can allow the smaller system to compete with the larger installation's electricity generation.
The value of a solar investment should be measured by the electricity it produces over time relative to the total money invested—not simply by the number of watts installed.
That is the distinction behind X3 Solar's technology.
8. The X3 Solar Lifetime Investment Advantage
Key consumer benefitX3 Solar advantageElectricity production per installed watt+60.2%Solar capacity required for equivalent production37.6% lessInitial investment in this comparison$4,500 lessProjected 25-year simple ROI253.7%Stationary solar projected 25-year simple ROI186.0%Relative improvement in ROI36.4% higher25-year financial gain after initial investment$48,202Estimated purchase-cost recovery6.7 years
THE X3 SOLAR DIFFERENCE
60.2% MORE LIFETIME ELECTRICITY PRODUCTION VALUE PER INSTALLED WATT.
5.68 kW OF X3 DUAL-AXIS SOLAR PRODUCES THE MODELED EQUIVALENT OF A 9.1 kW ROOFTOP SYSTEM.
36.4% HIGHER PROJECTED LIFETIME RETURN ON YOUR INVESTMENT.
$48,202 IN PROJECTED 25-YEAR FINANCIAL GAIN AFTER A $19,000 INITIAL INVESTMENT, BEFORE OPERATING EXPENSES.
Why pay for more solar capacity when smarter technology can deliver equivalent electricity production with fewer panels?
X3 Solar is changing how consumers should evaluate solar energy: not just by the number of panels they buy, but by how much financial and electrical value those panels produce throughout their operating lifetime.
X3 SOLAR CORP.
Smarter Solar. Greater Production. Better Returns.
X3Solar.com
Financial and Performance Methodology
The production comparison uses X3 Solar's actual field-performance observations establishing an estimated 5.68 kW dual-axis to 9.1 kW stationary production equivalence. This equivalence is extrapolated to annual and lifetime production for the financial calculations.
The analysis uses 13,650 kWh of first-year electricity production for each equivalently producing installation, a 25-year evaluation period, 0.5% annual module degradation, a constant electricity value of $0.209/kWh, and initial investments of $19,000 for X3 Solar and $23,500 for stationary solar.
The 60.2% production improvement is measured per installed watt. The 36.4% higher financial return compares the percentage simple ROI of the two investments. These are separate measurements.
The projections assume all generated electricity offsets purchased electricity at the stated retail rate. Results will differ with shading, weather, actual annual production, electricity usage, export compensation and equipment conditions. No future utility-rate increases are included.
Simple ROI equals accumulated electricity value minus initial investment, divided by initial investment. Figures exclude financing, tax incentives, operation and maintenance, mechanical servicing, equipment replacement, and the time value of money. A fully comparable customer quotation must include equivalent inverter, storage, backup and installation scope.
The estimates do not represent guaranteed production, lifetime performance, or financial returns.
© X3 Solar Corp. | X3Solar.com